Key Take Aways About Charting software
- Charting software transforms data into visual insights, aiding traders in trend and pattern detection.
- Key features include diverse timeframes, technical indicators, drawing tools, and customizable alerts.
- Common indicators: Moving Averages (trend direction), RSI (momentum), and Bollinger Bands (price range).
- Select software based on trading style and interface usability; consider cost for premium features.
- While not guaranteeing success, charting tools help in making informed trading decisions.
Why Does Charting Software Matter?
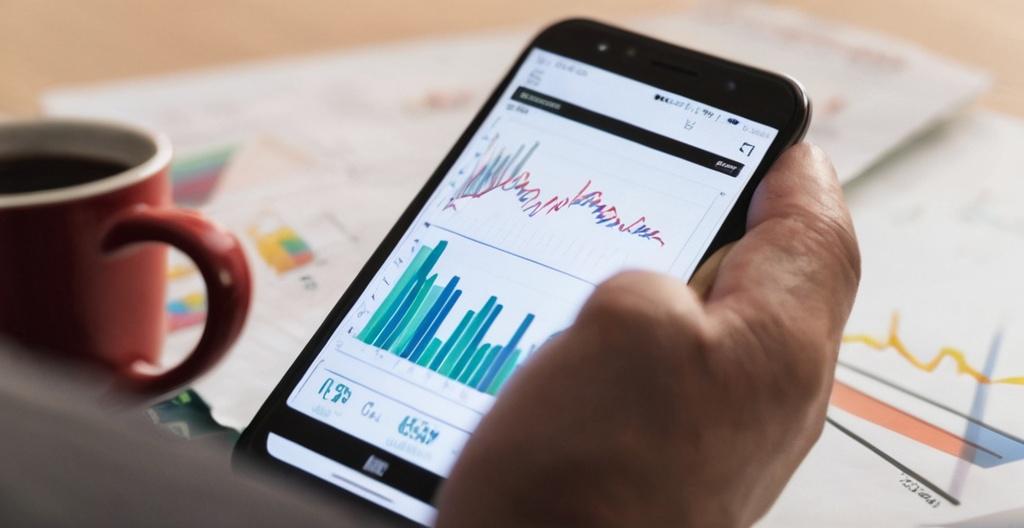
Charting software isn’t just another tool in the trader’s toolbox; it’s the canvas where data becomes art. It takes raw numbers and turns them into a visual story that speaks louder than words. Traders can spot trends, detect patterns, and, theoretically, predict market moves. Whether you’re a day trader, swing trader, or long-term investor, you’re gonna want to get the hang of using charts.
The Core Features of Charting Software
Most charting software comes loaded with the same basic features. But the devil, or in this case, the profit, is in the details.
- Timeframes: From tick charts to monthly charts, different timeframes give different perspectives.
- Indicators: You’ve got your moving averages, Bollinger Bands, and RSI, among others. These indicators help you interpret price movements.
- Drawing Tools: Lines, channels, and Fibonacci retracements, oh my! Traders love doodling on their charts.
- Customizable Alerts: Let’s face it, we can’t watch the charts 24/7. Alerts can keep you in the loop.
Technical Indicators: Decoding the Market Language
So, you’ve got your charting software, and it’s brimming with technical indicators. But which ones should you actually use? Here’s a rundown of some of the most common indicators you might encounter.
Moving Averages: They smooth out price data to identify the direction of the trend. Think of them as the training wheels for trend spotting.
Relative Strength Index (RSI): This momentum oscillator measures the speed and change of price movements. RSI values above 70 are considered overbought, and below 30, oversold.
Bollinger Bands: These nifty bands consist of a moving average and two standard deviations. It’s like a price containment field.
Real-World Applications and Use Cases
Picture a trader who swears by charts. She starts by analyzing historical price data using candle patterns and technical indicators. While she knows no method guarantees success, the visual representation helps guide her trading decisions.
Another trader prefers comparing multiple assets side-by-side. Imagine the power of layering charts of different stocks or currencies to see correlations or divergences.
Having stories like these adds a personal touch, doesn’t it? You probably have your own charting tale.
Picking the Right Charting Software
When choosing your charting software, consider your trading style. Are you a day trader requiring real-time data, or a swing trader who checks charts every few days?
Don’t forget to factor in the user interface. A clunky interface can make your trading experience more like navigating a minefield than a streamlined journey.
Cost Considerations
Charting software often comes with a price tag. Sure, there are free versions, but premium features might require a subscription. If you’re serious about trading, think of it like investing in a good pair of running shoes before a marathon.
In conclusion, charting software serves as the compass for traders navigating the choppy waters of the financial markets. While it doesn’t provide guaranteed success, it equips traders with insights and tools to make informed decisions. Whether you’re sketching trend lines or scrutinizing indicators, your chart is a reflection of your trading strategy—and hopefully, your path to profit.
Child Pages
- Bloomberg Terminal Charting Tool
- Bloomberg Terminal Charting Tool
- Bloomberg Terminal Charting Tool
- ChartIQ Charting Tool
- MetaTrader 4 (MT4) Charting Tool
- MetaTrader 5 (MT5) Charting Tool
- MotiveWave Charting Tool
- MultiCharts Charting Tool
- NinjaTrader Charting Tool
- ProRealTime Charting Tool
- Sierra Chart Charting Tool
- StockCharts Charting Tool
- TC2000 Charting Tool
- Thinkorswim Charting Tool
- TradingView Charting Tool
- TrendSpider Charting Tool